The time-intensity curve tool allows you to visualize the lesions' enhancement behavior (e.g. in Breast MRI) by plotting the signal intensity values over time after the administration of contrast material.
Plotting time-intensity curve
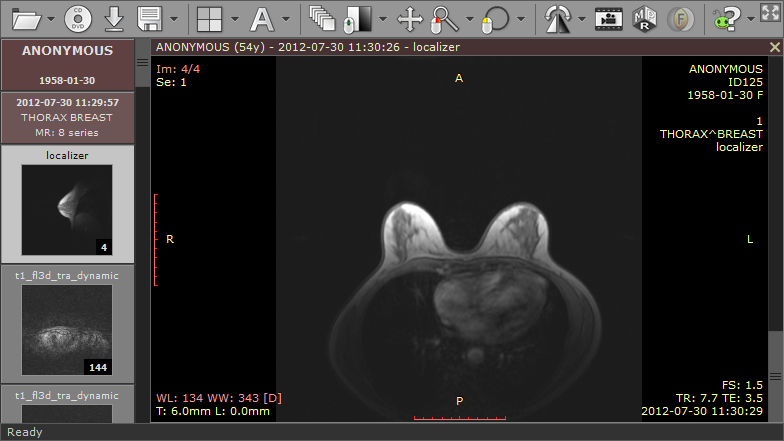
1) Open a study with dynamic sequences.
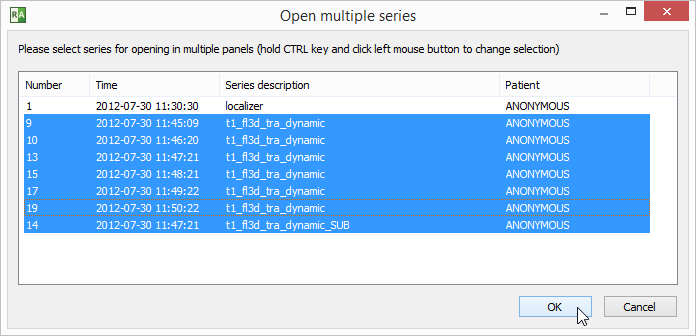
2) Press F4 to show the "Open multiple series" window, select the dynamic series (including the unenhanced one). A series with subtraction enabled will also come handy to quickly localize lesions.
3) Find a lesion that you would like to analyze and draw an ellipse over it.
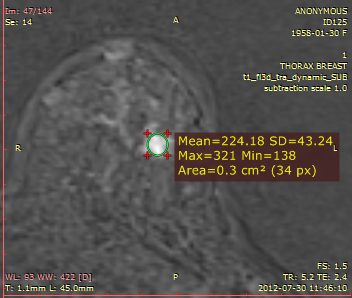
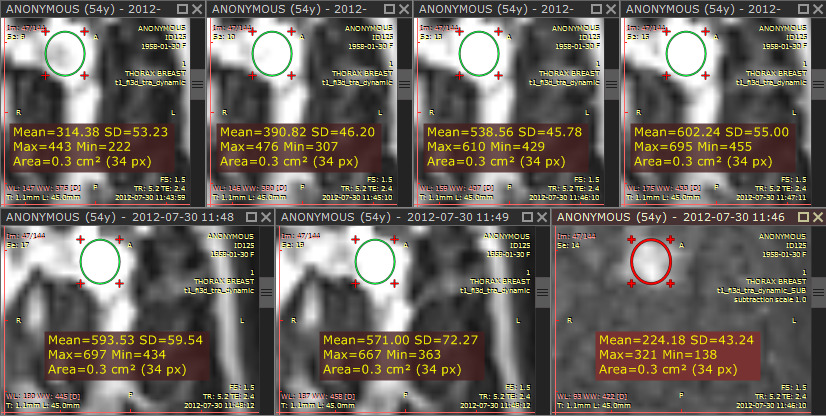
4) Quickly duplicate the ellipse ROI into other series by using the Ctrl + Shift + D shortcut.
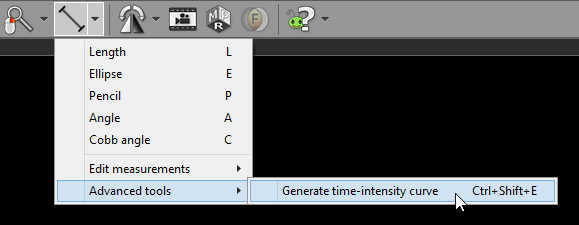
5) Select Time-intensity curve from Advanced tools or use Ctrl + Shift + E .
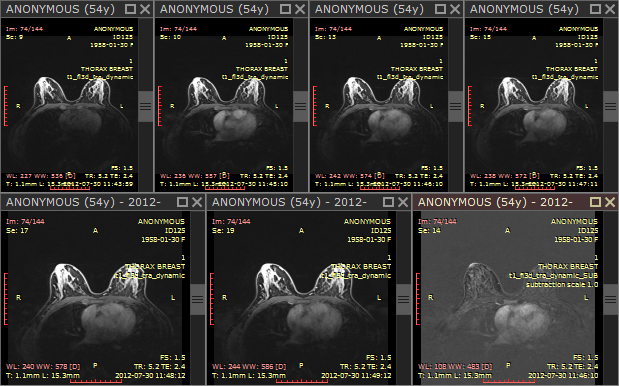
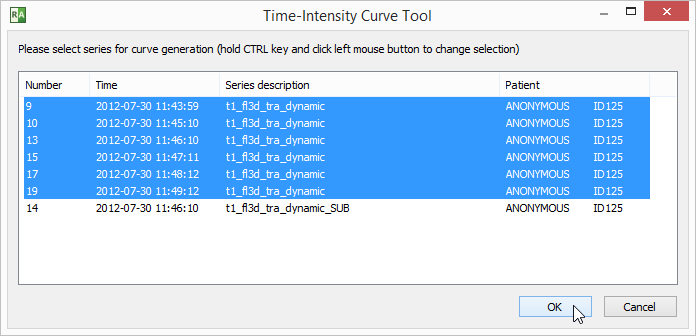
6) RadiAnt DICOM Viewer selects the series for curve generation automatically.
Make changes to the selection if you want to use other series. Click OK to confirm the selection and generate curve.
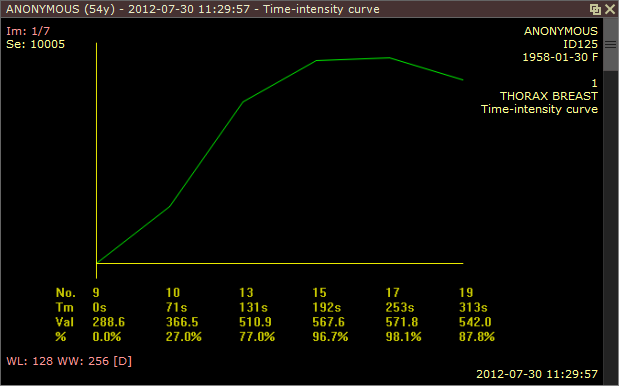
7) A new panel will be added. It contains the time-intensity curve and screen captures of the region in dynamic series used for calculations.
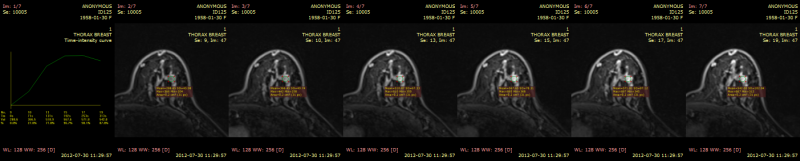
8) Maximize the panel (double-click it) to see the detailed curve.